Lesson 11: The tunnel effect

11.1 The tunnel effect – 11.2 The tunnel effect in nature and technology – 11.3 Simulation programs by Zollman – 11.4 The tunnel effect in schools
11.5 Progress check – 11.6 Summary

In the quantum world, it is possible to quickly wangle yourself through an energetically forbidden zone.” (Richard Feynman)

This chapter deals with the quantum theoretical background of this citation. The Nobel Prize for Binnig and Rohrer in 1986 puts the scanning tunneling microscope at the center of the applications of the tunnel effect.

This chapter contains the fundamentals of, and general information on the tunnel effect, but also makes proposals as to how the tunnel effect can be discussed in schools.

11.1 The tunnel effect

The potential well, in which the electrons are in bound states, was considered in Section 10.1. The potential barrier emerges from the potential well by reflection about the horizontal axis (cf. Fig. 11.1). The potential barrier causes the quantum objects to behave in a completely different way than is the case with the potential well. The bound states with quantized energy levels are missing, for example.
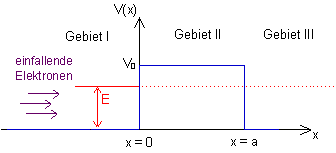
Fig. 11.1: Potential curve V_{(x)} and total energy E \le V_0

In classical physics, the barrier is an obstacle for any particle, and it cannot be overcome if the total energy E of the particle is less than the height V_0 of the barrier. The situation is different in quantum mechanics:

A wave coming in from the left is partially reflected, but the remainder passes though the barrier into region III. This happens although region II is forbidden for the quantum object from an energy point of view. The solution of the Schrödinger equation provides more details:

The Schrödinger equation for the potential barrier and its solution

The Schrödinger equation

    \[ \left( \hat{E}_{kin} + V_{(x)} \right) \psi_{(x)} = E \cdot \psi_{(x)} \]

in regions I, II and III is:

Region I Region II Region III
\displaystyle {-\frac{\hbar^2}{2m} \frac{d^2}{dx^2} \psi = E \cdot \psi} \displaystyle {- \left( \frac{\hbar^2}{2m} \frac{d^2}{dx^2} + V_0 \right) \psi = E \cdot \psi} \displaystyle {- \frac{\hbar^2}{2m} \frac{d^2}{dx^2} \psi = E \cdot \psi}
rearranged:
\displaystyle {\frac{d^2}{dx^2} \psi = -\frac{2mE}{\hbar^2} \cdot \psi}
rearranged:
\displaystyle {\frac{d^2}{dx^2} \psi = - \frac{2m(E-V_o)}{\hbar^2} \cdot \psi}
rearranged:
\displaystyle {\frac{d^2}{dx^2} \psi = - \frac{2mE}{\hbar^2} \cdot \psi}

Each of the equations has two independent solution functions. To obtain a solution for the whole region, the parts of the solution have to be suitably combined so that the transitions are continuous and continuously differentiable. One of the possible overall solutions has the following form:

\psi_{(x)} = \left\lbrace \begin{array}{ccc} - \frac{k_2}{k_1}sin(k_1x) + cos(k_1x) \hspace{158pt} falls \: x \le 0 \\ exp(-k_2x) \hspace{200pt} falls \: 0 < x < a \\ exp(-k_2a) \cdot \left( - \frac{k_2}{k_1}sin(k_1(x-a)) + cos(k_1(x-a)) \right) \hspace{28pt} falls \: a \le x \end{array}

with

    \[ k_1 = \frac{1}{\hbar} \sqrt{2mE} \hspace{15pt} und \hspace{15pt} k_2 = \frac{1}{\hbar} \sqrt{2m(E-V_0)} \]

Here, only the exponentially decreasing partial solution has been used for region II. In this case, the intensity in region III is only a fraction of the intensity in region I. To a good approximation, this low intensity in region III can be considered as that part of the main wave of region I which has tunneled through.

Why is this only an approximation?

To determine the degree of transmission T, the intensities (squares of the absolute value of the wave function) of the corresponding regions are determined and expressed as a ratio. For the wave function stated above we obtain:

    \[ \displaystyle{ T = e^{- \sqrt{2m(E-V_0)} \frac{2a}{\hbar}}} \]

The degree of transmission T is a measure of how well the barrier can be tunneled through: The higher the barrier compared to the total energy, the lower is the probability that the barrier is tunneled through.

11.2 The tunnel effect in nature and technology

This section provides a brief overview of the applications of the tunnel effect:

Field emission microscope

Source: Das Quantenuniversum, Tony Hey and Patrick Walter, pp. 89ff

The basis of this application is the idea that electrons in a metal can move approximately as if they were in the interior of a potential well. The boundary surfaces of the metal correspond to the walls of the potential well, which the electrons cannot leave without being supplied with energy (cf. photoelectric effect).

Fig.11.2 Potential model of a metal

If the metal (e. g. a wire or small sphere) is charged so it carries a large negative charge with respect to the surroundings, the form of the potential changes, cf. Fig. 11.3:

Fig.11.3 Potential model of a metal with external field

In a vacuum, there is a certain probability that a barrier with this form of potential can be tunneled through by the electrons. Very high field strengths are needed to achieve observable effects, however. This makes very thin metal tips particularly suitable. It was possible to experimentally prove the existence of such a “field emission process” as early as 1928.

This effect is used especially in the field emission microscope. Electrons which have tunneled through the potential barrier are accelerated in an almost straight line in the external electric field (electric field strength of approx. 109 \frac{V}{m}). If the needle is surrounded by a phosphorescing screen, a greatly magnified image of the needle tip is obtained, which is composed of the light spots of the impinging electrons. Since the electrons at the corners are the easiest to dislodge, these regions are imaged most brightly.

Diffraction phenomena of the light electrons prevent the resolution from being sufficiently high to resolve individual atoms, however. This resolution can only be achieved when the imaging is carried out not with electrons but with ions, especially helium ions. To do this, the metal tip is positively charged and surrounded by a diluted helium gas. The helium atoms close to the tip release electrons to it. The remaining positive ions are subsequently accelerated in the electric field. This variant is called a field ion microscope.

The magnification of the two field microscopes is many million-fold to a few billion-fold. While structures imaged with the field emission microscope are always blurred, atomic-level resolution is possible with the field ion microscope.


Tungsten needle, imaged with a
a) Field emission microscope                                         b) Field ion microscope

Illustrations from “Das Quantenuniversum”
by T. Hey and P. Walters, p. 91
Scanning tunneling microscope

Source: Largely as per Kuhn Physik 2, p.325 (1st Edition 2000)

A voltage is applied between two conductors which are close to each other, but not in contact. In an ultra-high vacuum, electrons can then tunnel through the potential barrier existing between the conductors. A tunnel current flows whose size decreases exponentially with the width of the potential barrier. This dependence of the tunnel current facilitates the construction of a new type of microscope, whose resolution surpasses that of all previously known microscopes by orders of magnitude. This scanning tunneling microscope, whose invention earned G. Binning and H. Rohrer the Nobel Prize for Physics in 1986, can be used to image atomic structures directly.

Fig. 11.4: Principle construction of the scanning tunneling microscope

Fig. 11.5: The “smallest hole in the world”: Image of an MoS2 surface in which a single atom is missing, taken with a scanning tunneling microscope (source: W.Heckl, LMU Munich)

To this end, a fine tip scans the surface of the object under investigation. The height of the tip above the surface can be adjusted very accurately. It is set such that a detectable tunnel current flows between the tip and the surface. During the scan, the height of the tip is continuously readjusted such that the tunnel current remains constant. This causes the tip to maintain approximately the same distance from the surface. (Local charge displacements and lattice defects can simulate an incorrect topology.) By recording the tip height for each point, we obtain a height profile of the surface. The method is so sensitive that it is possible to make out individual atoms on the surface.

α-decay

Source: Kuhn Physik 2, p. 368 (1st Edition 2000)

The question now arises: How can an α-particle leave the nucleus at all, when its energy is not sufficient to overcome the potential well? – When atoms decay, why not all at the same time?

In the nucleus, the nuclear building blocks (nucleons) experience different forces, which lead to a potential with approximately the following form:

Fig. 11.6: Classical particle in the potential well

Fig. 11.7: Quantum mechanical particle in the potential well
The tunnel effect explains α-decay

All nucleons are attracted to each other by a short-range nuclear force. This leads to the potential well (in the center). The protons electrostatically repel each other, however. Since this force becomes weaker with distance, but does not disappear completely, it gives rise to this potential, which resembles a volcanic crater.

There are species of nuclei where the energy of the individual nucleons in the well is so high that the individual nucleons can exist outside the atomic nucleus as well. The direct path is barred by the potential barrier, however. Being quantum objects, the nucleons with higher energies can tunnel through the barrier. Individual protons can thus vaporize from the atomic nucleus.

Much more frequent that the emission of individual nucleons is the observation of alpha decay, i. e. the emission of a helium nucleus. This is down to the high binding energy of the nucleons in the alpha particle. While the energy of a nucleon in the nucleus is often not sufficient for the free state, the energy can be high enough that a combination of four nucleons can exist in the free state as an alpha particle. In this case, an alpha particle can tunnel out of the atomic nucleus, but not an individual nucleon. How well the wave function of the nucleons or alpha particle can penetrate the barrier is determined by the height and width of the potential. Although the intensity outside the atomic nucleus is low for radioactive nuclei, it is greater than zero. This intensity is also a measure for how easily or quickly nuclei of this species decay.

Sunshine with the aid of the tunnel effect

As is well known, the Sun obtains its energy from nuclear fusion. A total of four protons fuse to form a helium nucleus and several lighter reaction products. Since the nuclear force important for fusion has only a very short range, the charged ions have to approach each other very closely in order to fuse. They therefore require sufficient kinetic energy to overcome the electrostatic repulsion. In this section we use an estimate to show that the ions cannot have the kinetic energy necessary for the temperature in the interior of the Sun and therefore other mechanisms (the tunnel effect) must come into play for the Sun to function in the way we observe.

Estimate of the minimum energy

An elementary fusion process is considered by way of example. Two protons fuse to form one deuterium and several lighter reaction products:

    \[ ^1_1H+^1_1H \rightarrow ^2_1H +^0_1e +^0_0v \]

For the protons to be attracted by the nuclear force, the protons have to approach to within the range of the strong interaction. The necessary distance is approx. 1fm = 10^{-15}m; the protons therefore have to almost make contact. A kinetic energy of approx. 1 MeV is required for this (to allow an approach to exactly 1 fm, a kinetic energy of

    \[ E_{kin}= \frac{1}{4 \pi \epsilon_0} \cdot \frac{e^2}{1,0 fm} \]

1.4 MeV is necessary.)

Temperature and minimum energy

For the temperature estimate, the plasma in the interior of the Sun can be assumed to be an ideal gas, whose average kinetic energy is given by:

    \[ \bar{E}_{kin}= \frac{3}{2} kT \]

The estimated minimum energy of 1 MeV then corresponds to a temperature of just under 8 \cdot 10^9K. The temperature in the interior of the Sun of approx. 15 million degrees is lower by a factor of 500, i. e. approx. 3 orders of magnitude. This discrepancy cannot be explained by errors in the estimate.

Since not all particles in a gas have the same energy, it is possible that at least a smaller fraction of the ions reach this critical energy as part of the Maxwell-Boltzmann distribution. The frequency distribution rapidly drops exponentially in the region of interest, however, so that practically no particle in the Sun has the necessary energy. (The difference in the probability density between the most prevalent energy and the minimum energy calculated above is more than 100 orders of magnitude. With approx. 10^57 protons, there is a probability of less than 10^-43 that the Sun has a suitable high-energy proton.)

The Sun is therefore too cold to be able to obtain its energy from nuclear fusion according to classical theory.

The tunnel effect makes it possible

When two protons move only a little bit closer to one another, they can fuse together with the aid of the tunnel effect: The Coulomb barrier remaining can be surmounted quantum mechanically. The tunneling rate increases, the closer the protons get. Approaches which are sufficiently close are – as estimated above – very rare, however. When the velocity distribution and the tunneling probability are taken into account, the result is that two protons of approximately 5 keV make the most frequent contribution to fusion in our Sun (Gamow peak). For the fusion of 2He_3 nuclei to one He_4 nucleus and two protons, the maximum is at 21 keV.

So how common or how rare are fusion processes at specific energies?

To be able to estimate this, the degree of transmission (tunneling probability for an approach event) is calculated for the case that two protons approach head-on up to a separation x. The potential U_{(r)} is the Coulomb potential and the kinetic energy is U_{(x)}. It is assumed here that the nuclear force is effective below a separation of x_0=1 fm and dominates the electric force.

    \[ T \approx exp \left( - \frac{2}{ \hbar} \int_{x_0}^x \sqrt{2m(U_{(r)}-U_{(x)})}dr \right) \]

In the table below, the associated energies and also the degrees of transmission are given for several minimal separations:

Separation in 10-12 m     Energy in keV   Tunneling probability Comment
 0,2  14  9 · 10-7
 0,5  5,8  1,6 · 10-10 approx. energy with max. fusion rate
 1,0  2,9  9 · 10-15 approx. most frequent particle energy
 2,0  1,4  9 · 10-21

The tunneling probability therefore has a very sensitive dependence on the minimal separation achieved. The doubling of the separation already corresponds to a tunneling probability which is reduced by many orders of magnitude.

The values in the table are estimated for head-on collisions. Head-on collisions hardy ever happen in reality, however. At a specific particle energy, the minimum separation is therefore larger and the fusion probability much lower still. Nevertheless, the tunneling effect is absolutely imperative for the Sun’s fusion reactor to work.

11.3 Simulation programs by Zollman

Some of the simulation programs from “Visual Quantum Mechanics” at Kansas State University have already been described in Section 10.4. The corresponding simulations for the tunnel effect are briefly presented here:

Quantum Tunneling

The simulation reproduces the situation of a particle which tunnels through the barrier described in Section 11.1. The stationary solution of the Schrödinger equation is used as an approximation for the transport process of a wave through the barrier. This simulation lends itself particularly well to the investigation of two phenomena:

  1. The ratio of the intensities in front of and behind the barrier (“probability density”);
  2. The dependence of the degree of transmission on the particle energy or particle species (“T vs. E”).

The real or the imaginary part of the wave function or the probability density function can also be displayed, as desired. The user can select the form and the height of the potential barrier themself with “Barrier Parameters”. The particle species (electron, pion, …) is selected with “particle parameters”. In addition, the value of h can be changed at “Planck’s Constant”.

http://phys.educ.ksu.edu/vqm/html/qtunneling.html

Quantum motion

A film shows the temporal evolution of a wave which is scattered by a scalable potential. It is possible to also stack two potentials one after the other here.

https://perg.phys.ksu.edu/vqmorig/programs/java/qumotion/quantum_motion.html

11.4 The tunnel effect in schools

Analogies to the tunnel effect

The information for these explanations is obtained from: “Das Quantenuniversum”, Hey & Walters, pp.85ff

The tunnel effect with waves:

The tunnel effect can be demonstrated with the aid of the total internal reflection of light. Light whose amplitude attenuates exponentially with the distance from the surface also appears behind the surface which causes total internal reflection. If a second prism is moved towards and parallel to the glass surface giving rise to the total internal reflection of the first prism, and if the distance is such that the “attenuating wave” reaches right to the second prism, we notice a light beam in the second prism. The closer the prisms are to each other, the more light is transmitted, since the amplitude in the forbidden air layer has correspondingly less time to attenuate. This phenomenon is often also called “frustrated total internal reflection”. This phenomenon is nothing more than the quantum mechanical tunnel effect with de Broglie’s matter waves. In optics, this effect is used as a beam splitter to split up the light.

Fig. 11.8: Tunnel effect with total internal reflection

The experiment with light is difficult to carry out in schools. The experiment can be done much more easily with microwaves and paraffin prisms.

Roller coaster model

The roller coaster model is a very graphic explanation of the tunnel effect. A car starts from rest at point A. Energy conservation means it cannot get any higher than point B. But because of the tunnel effect, there is a probability of finding the car at point C.

Here you can find an experimental set-up for the tunnel effect.

11.5 Progress check

After working through Chapter 11, you should be able to answer the following questions:

  • What is the Schrödinger equation for the three regions of the potential barrier?
  • Which approach is used for the solution? What does the transmission coefficient state and what does it depend on?
  • What do we mean by the tunnel effect?
  • How does
    1. the field emission microscope,
    2. the scanning tunneling microscope work?
  • How can α-decay be explained?
  • Which possibilities exist in schools to illustrate the tunnel effect?

11.6 Summary of Chapter 11: The tunnel effect

The tunnel effect states that particles can pass through energetically forbidden zones. The degree of transmission T can be estimated via the solution of the stationary Schrödinger equation:

    \[ T = e^{- \sqrt{2m(E-V_0)} \frac{2a}{\hbar}} \]

Strong electric fields enable electrons to tunnel from a metal into an energetically allowed region of the field (application: field emission microscope).

Electrons can similarly tunnel through a narrow slit from one metal into another metal (application: scanning tunneling microscope).

In α-decay, the tunneling objects are α-particles which are emitted by the nucleus with a certain probability.

The tunnel effect can be illustrated with the aid of the total internal reflection of light or microwaves.

Zurück